visped function draws a graph of a full or compact pedigree.
Usage
visped(
  ped,
  compact = FALSE,
  outline = FALSE,
  cex = NULL,
  showgraph = TRUE,
  file = NULL,
  highlight = NULL,
  trace = FALSE,
  showf = FALSE,
  labelvar = NULL,
  shapeby = c("sex", "role"),
  pagewidth = 200,
  symbolsize = 1,
  maxiter = 1000,
  genlab = FALSE,
  genlabcex = NULL,
  ...
)
Arguments
- ped
A
tidypedobject (which inherits fromdata.table). It is recommended that the pedigree is tidied and pruned by candidates using thetidypedfunction with the non-null parametercand.- compact
A logical value indicating whether terminal, non-parent full-sib individuals will be replaced by one family display node. For example, 100 eligible full siblings are shown as
"FS×100"whencompact = TRUE. Highlighted individuals are not compacted, and the underlying pedigree is unchanged. The default value is FALSE.- outline
A logical value indicating whether shapes without labels will be shown. A graph of the pedigree without individual labels is shown when setting
outline = TRUE. This is useful for viewing the pedigree outline and identifying immigrant individuals in each generation when the graph width exceeds the maximum PDF width (500 inches). The default value is FALSE.- cex
NULL or a numeric value changing the size of individual labels shown in the graph. cex is an abbreviation for 'character expansion factor'. The
vispedfunction will attempt to estimate (cex=NULL) the appropriate cex value and report it in the messages. Based on the reported cex from a previous run, this parameter should be increased if labels are wider than their shapes in the PDF; conversely, it should be decreased if labels are narrower than their shapes. The default value is NULL.- showgraph
A logical value indicating whether a plot will be shown in the default graphic device (e.g., the Plots panel in RStudio). This is useful for quick viewing without opening a PDF file. However, the graph on the default device may not be legible (e.g., overlapping labels or aliasing lines) due to size restrictions. It is recommended to set
showgraph = FALSEfor large pedigrees. The default value is TRUE.- file
NULL or a character value specifying whether the pedigree graph will be saved as a vector file. Files ending in '.svg' are written with the SVG device; all other file names use PDF output. The vector output is legible and avoids overlapping labels even with many individuals or long labels. It is recommended to save the pedigree graph as a vector file. The default value is NULL.
- highlight
NULL, a character vector of individual IDs, or a list specifying individuals to highlight. If a character vector is provided, individuals will be highlighted with a purple border while preserving their sex-based fill color. If a list is provided, it should contain:
ids: (required) character vector of individual IDs to highlight.frame.color: (optional) hex color for the border of focal individuals.color: (optional) hex color for the fill of focal individuals.rel.frame.color: (optional) hex color for the border of relatives (used whentraceis not NULL).rel.color: (optional) hex color for the fill of relatives (used whentraceis not NULL).
For example:
c("A", "B")orlist(ids = c("A", "B"), frame.color = "#9c27b0"). The function will check if the specified individuals exist in the pedigree and issue a warning for any missing IDs. The default value is NULL.- trace
A logical value or a character string. If TRUE, all ancestors and descendants of the individuals specified in
highlightwill be highlighted. If a character string, it specifies the tracing direction: "up" (ancestors), "down" (descendants), or "all" (union of ancestors and descendants). This is useful for focusing on specific families within a large pedigree. The default value is FALSE.- showf
A logical value indicating whether inbreeding coefficients will be shown in the graph. If
showf = TRUEand the column f is missing,visped()will try to compute it automatically withinbreedon a structurally complete pedigree. If automatic computation is not possible, a warning is issued and labels are drawn without f. The default value is FALSE.- labelvar
NULL, a single non-empty character value naming a column in
ped, or a character vector with one displayed label per input pedigree row. Row-aligned vectors are attached before any internal tidying or reordering. Compact full-sib family nodes still show family size whencompact = TRUE. Missing or empty values fall back to individual IDs. The default value is NULL.- shapeby
Character string controlling what node shapes encode.
"sex"(default) uses circles for females, squares for males, diamonds for unknown sex, and hexagons for monoecious individuals."role"distinguishes individual records from compact family summaries by shape while keeping sex-based fill colors for real individuals. Compact family summaries are rectangles in both modes.- pagewidth
A numeric value specifying the width of the PDF file in inches. This controls the horizontal scaling of the layout. The default value is 200.
- symbolsize
A numeric value specifying the scaling factor for node size relative to the label size. Values greater than 1 increase the node size (adding padding around the label), while values less than 1 decrease it. This is useful for fine-tuning the whitespace and legibility of dense graphs. The default value is 1.
- maxiter
An integer specifying the maximum number of iterations for the Sugiyama layout algorithm to minimize edge crossings. Higher values (e.g., 2000 or 5000) may result in fewer crossed lines for complex pedigrees but will increase computation time. The default value is 1000.
- genlab
FALSE to omit generation labels; TRUE to draw the default labels G1, G2, ...; or an unnamed, non-empty character vector of custom labels. Custom labels are assigned from top to bottom to the final displayed generation layers and must contain exactly one label per layer. The default value is FALSE.
- genlabcex
NULL or a numeric value controlling the size of displayed generation labels. If
NULL,visped()uses an automatic size based on node scaling. Set a larger value to keep generation labels readable in deep pedigrees. The default value is NULL.- ...
Additional arguments passed to
plot.igraph.
Value
The function mainly produces a plot on the current graphics device and/or a vector file. It invisibly returns a list containing the graph object, layout coordinates, and node sizes.
Details
This function takes a pedigree tidied by the tidyped function and outputs a hierarchical graph for all individuals in the pedigree. The graph can be shown on the default graphic device or saved as a PDF or SVG file. The vector output is legible and avoids overlapping labels. It is especially useful when the number of individuals is large and individual labels are long.
Rendering is performed using a Two-Pass strategy: edges are drawn first to ensure center-to-center connectivity, followed by nodes and labels. This ensures perfect visual alignment in high-resolution vector outputs. The function also supports real-time ancestry and descendant highlighting.
This function can draw the graph of a very large pedigree (> 10,000 individuals per generation) by compacting full-sib individuals. It is highly effective for aquatic animal pedigrees, which usually include many full-sib families per generation in nucleus breeding populations. The outline of a pedigree without individual labels is still shown if the width of a pedigree graph exceeds the maximum width (500 inches) of the PDF file.
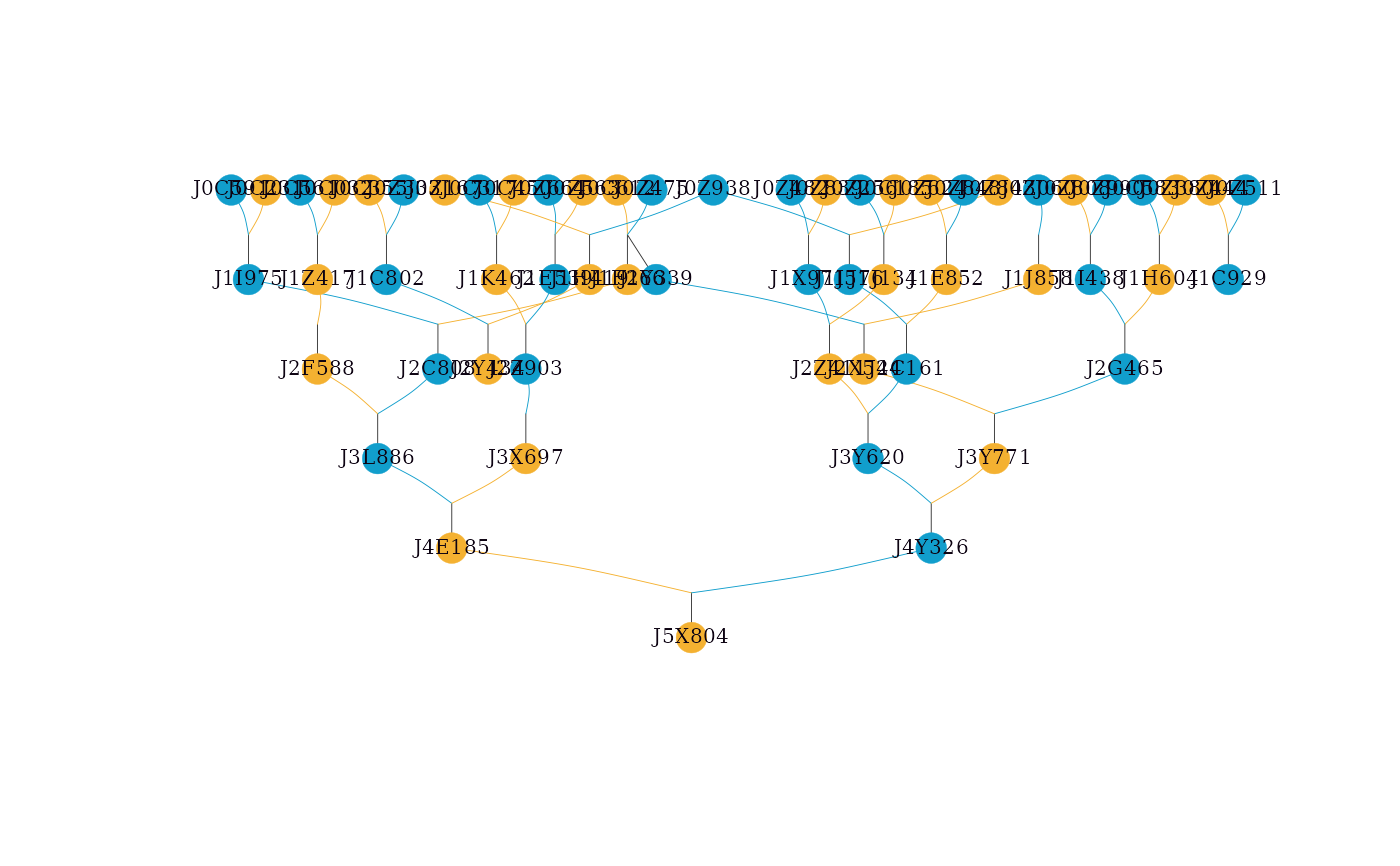
By default, shapeby = "sex" encodes individual sex with node shape:
females are circles, males are squares, individuals of unknown sex are
diamonds, and monoecious individuals are hexagons. Set
shapeby = "role" to use the legacy role-based scheme, where circles
represent individual records and green-grey rectangles represent compact
full-sib family summaries. Compact family summaries remain green-grey
rectangles in both modes. In shapeby = "role" mode, real individuals
remain circles, but their fill colors still encode sex. Dark sky blue
indicates males, dark goldenrod indicates females, teal indicates monoecious
individuals, and neutral grey indicates unknown sex. Purple borders indicate
highlighted individuals rather than sex.
Note
Isolated individuals (those with no parents and no progeny, assigned Gen 0) are automatically filtered out and not shown in the plot. A message will be issued if any such individuals are removed.
See also
tidyped for tidying pedigree data (required input)
vismat for visualizing relationship matrices as heatmaps
pedmat for computing relationship matrices
splitped for splitting pedigree into connected components
plot.igraph underlying plotting function
Examples
library(visPedigree)
library(data.table)
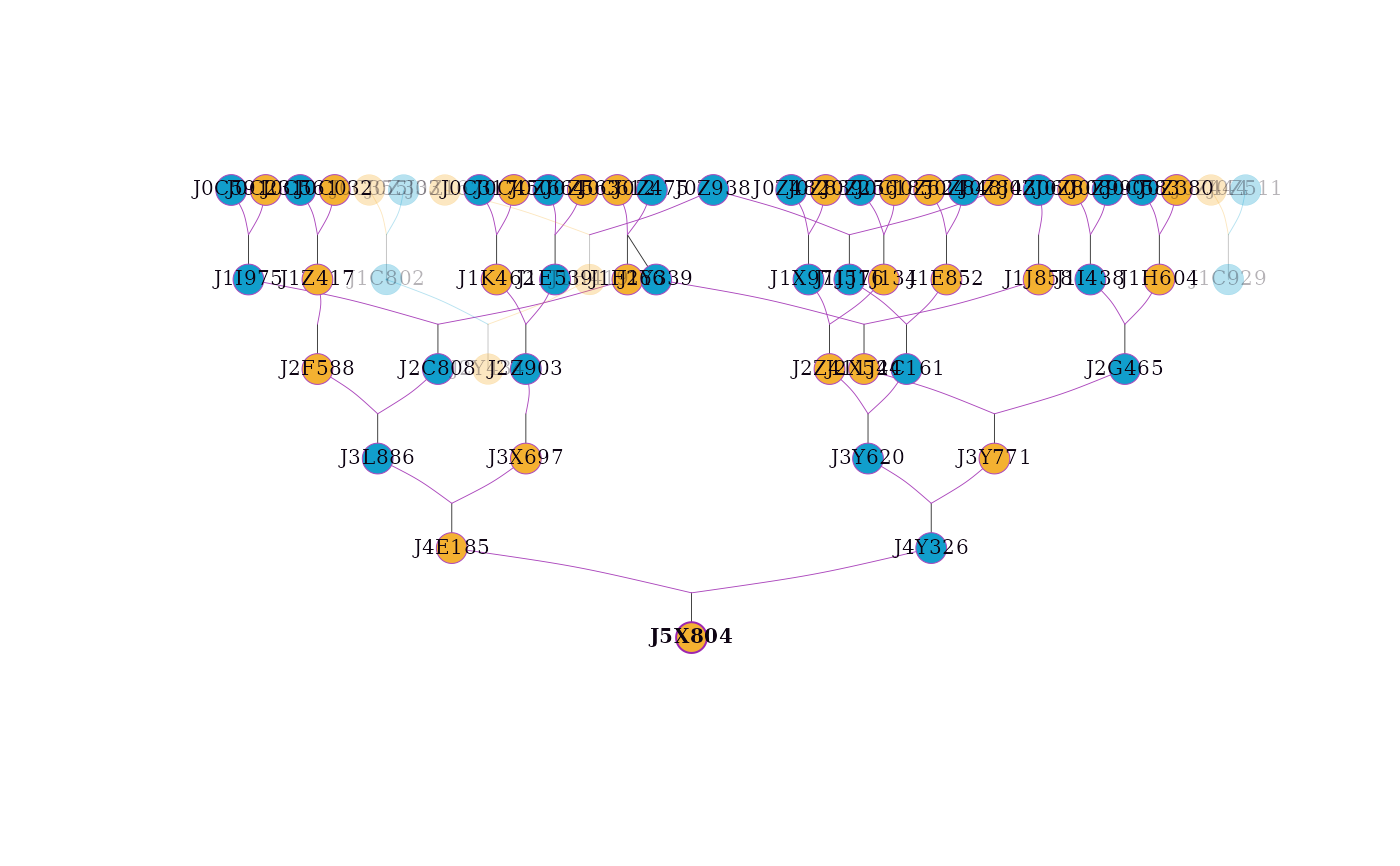
# Drawing a simple pedigree
simple_ped_tidy <- tidyped(simple_ped)
visped(simple_ped_tidy,
cex=0.25,
symbolsize=5.5)
 #> Label cex: 0.25. Symbol size: 5.5. Adjust 'cex' and 'symbolsize' if labels are too large or small.
#> Tip: Use 'file' to save as a legible vector PDF or SVG.
# Use application-specific labels for the displayed generations.
# Custom labels are assigned from top to bottom.
generation_labels <- paste("Generation", sort(unique(simple_ped_tidy$Gen)))
visped(simple_ped_tidy,
genlab = generation_labels,
cex = 0.25,
symbolsize = 5.5)
#> Label cex: 0.25. Symbol size: 5.5. Adjust 'cex' and 'symbolsize' if labels are too large or small.
#> Tip: Use 'file' to save as a legible vector PDF or SVG.
# Use application-specific labels for the displayed generations.
# Custom labels are assigned from top to bottom.
generation_labels <- paste("Generation", sort(unique(simple_ped_tidy$Gen)))
visped(simple_ped_tidy,
genlab = generation_labels,
cex = 0.25,
symbolsize = 5.5)
 #> Label cex: 0.25. Symbol size: 5.5. Generation label cex: 0.909090909. Adjust 'cex', 'symbolsize', and 'genlabcex' if labels are too large or small.
#> Tip: Use 'file' to save as a legible vector PDF or SVG.
# Highlighting an individual and its ancestors and descendants
visped(simple_ped_tidy,
highlight = "J5X804",
trace = "all",
cex=0.25,
symbolsize=5.5)
#> Label cex: 0.25. Symbol size: 5.5. Generation label cex: 0.909090909. Adjust 'cex', 'symbolsize', and 'genlabcex' if labels are too large or small.
#> Tip: Use 'file' to save as a legible vector PDF or SVG.
# Highlighting an individual and its ancestors and descendants
visped(simple_ped_tidy,
highlight = "J5X804",
trace = "all",
cex=0.25,
symbolsize=5.5)
 #> Label cex: 0.25. Symbol size: 5.5. Adjust 'cex' and 'symbolsize' if labels are too large or small.
#> Tip: Use 'file' to save as a legible vector PDF or SVG.
# Showing inbreeding coefficients in the graph
simple_ped_tidy_inbreed <- tidyped(simple_ped, inbreed = TRUE)
visped(simple_ped_tidy_inbreed,
showf = TRUE,
cex=0.25,
symbolsize=5.5)
#> Label cex: 0.25. Symbol size: 5.5. Adjust 'cex' and 'symbolsize' if labels are too large or small.
#> Tip: Use 'file' to save as a legible vector PDF or SVG.
# Showing inbreeding coefficients in the graph
simple_ped_tidy_inbreed <- tidyped(simple_ped, inbreed = TRUE)
visped(simple_ped_tidy_inbreed,
showf = TRUE,
cex=0.25,
symbolsize=5.5)
 #> Label cex: 0.25. Symbol size: 5.5. Adjust 'cex' and 'symbolsize' if labels are too large or small.
#> Tip: Use 'file' to save as a legible vector PDF or SVG.
#> Note: Inbreeding coefficients of 0 are not shown in the graph.
# visped() will automatically compute inbreeding coefficients if 'f' is missing
visped(simple_ped_tidy,
showf = TRUE,
cex=0.25,
symbolsize=5.5)
#> Note: 'showf = TRUE' requested but 'f' column was missing. Calculated inbreeding coefficients automatically.
#> Label cex: 0.25. Symbol size: 5.5. Adjust 'cex' and 'symbolsize' if labels are too large or small.
#> Tip: Use 'file' to save as a legible vector PDF or SVG.
#> Note: Inbreeding coefficients of 0 are not shown in the graph.
# Use the role-based legacy symbol scheme
visped(simple_ped_tidy,
shapeby = "role",
cex=0.25,
symbolsize=5.5)
#> Label cex: 0.25. Symbol size: 5.5. Adjust 'cex' and 'symbolsize' if labels are too large or small.
#> Tip: Use 'file' to save as a legible vector PDF or SVG.
#> Note: Inbreeding coefficients of 0 are not shown in the graph.
# visped() will automatically compute inbreeding coefficients if 'f' is missing
visped(simple_ped_tidy,
showf = TRUE,
cex=0.25,
symbolsize=5.5)
#> Note: 'showf = TRUE' requested but 'f' column was missing. Calculated inbreeding coefficients automatically.
#> Label cex: 0.25. Symbol size: 5.5. Adjust 'cex' and 'symbolsize' if labels are too large or small.
#> Tip: Use 'file' to save as a legible vector PDF or SVG.
#> Note: Inbreeding coefficients of 0 are not shown in the graph.
# Use the role-based legacy symbol scheme
visped(simple_ped_tidy,
shapeby = "role",
cex=0.25,
symbolsize=5.5)
 #> Label cex: 0.25. Symbol size: 5.5. Adjust 'cex' and 'symbolsize' if labels are too large or small.
#> Tip: Use 'file' to save as a legible vector PDF or SVG.
# Adjusting page width and symbol size for better layout
# Increase pagewidth to spread nodes horizontally in the pdf file
# Increase symbolsize for more padding around individual labels
visped(simple_ped_tidy,
cex=0.25,
symbolsize=5.5,
pagewidth = 100,
file = tempfile(fileext = ".pdf"))
#> Pedigree saved to: /tmp/RtmprOiyK6/file1c1f3fb10838.pdf
#> Label cex: 0.25. Symbol size: 5.5. Adjust 'cex' and 'symbolsize' if labels are too large or small.
#> Label cex: 0.25. Symbol size: 5.5. Adjust 'cex' and 'symbolsize' if labels are too large or small.
#> Tip: Use 'file' to save as a legible vector PDF or SVG.
# Adjusting page width and symbol size for better layout
# Increase pagewidth to spread nodes horizontally in the pdf file
# Increase symbolsize for more padding around individual labels
visped(simple_ped_tidy,
cex=0.25,
symbolsize=5.5,
pagewidth = 100,
file = tempfile(fileext = ".pdf"))
#> Pedigree saved to: /tmp/RtmprOiyK6/file1c1f3fb10838.pdf
#> Label cex: 0.25. Symbol size: 5.5. Adjust 'cex' and 'symbolsize' if labels are too large or small.
 # Saving pedigree as SVG with larger labels and tighter symbols
visped(simple_ped_tidy,
cex=0.8,
symbolsize=1,
pagewidth = 100,
file = tempfile(fileext = ".svg"))
#> Pedigree saved to: /tmp/RtmprOiyK6/file1c1f5f1598e6.svg
#> Label cex: 0.8. Symbol size: 1. Adjust 'cex' and 'symbolsize' if labels are too large or small.
# Saving pedigree as SVG with larger labels and tighter symbols
visped(simple_ped_tidy,
cex=0.8,
symbolsize=1,
pagewidth = 100,
file = tempfile(fileext = ".svg"))
#> Pedigree saved to: /tmp/RtmprOiyK6/file1c1f5f1598e6.svg
#> Label cex: 0.8. Symbol size: 1. Adjust 'cex' and 'symbolsize' if labels are too large or small.
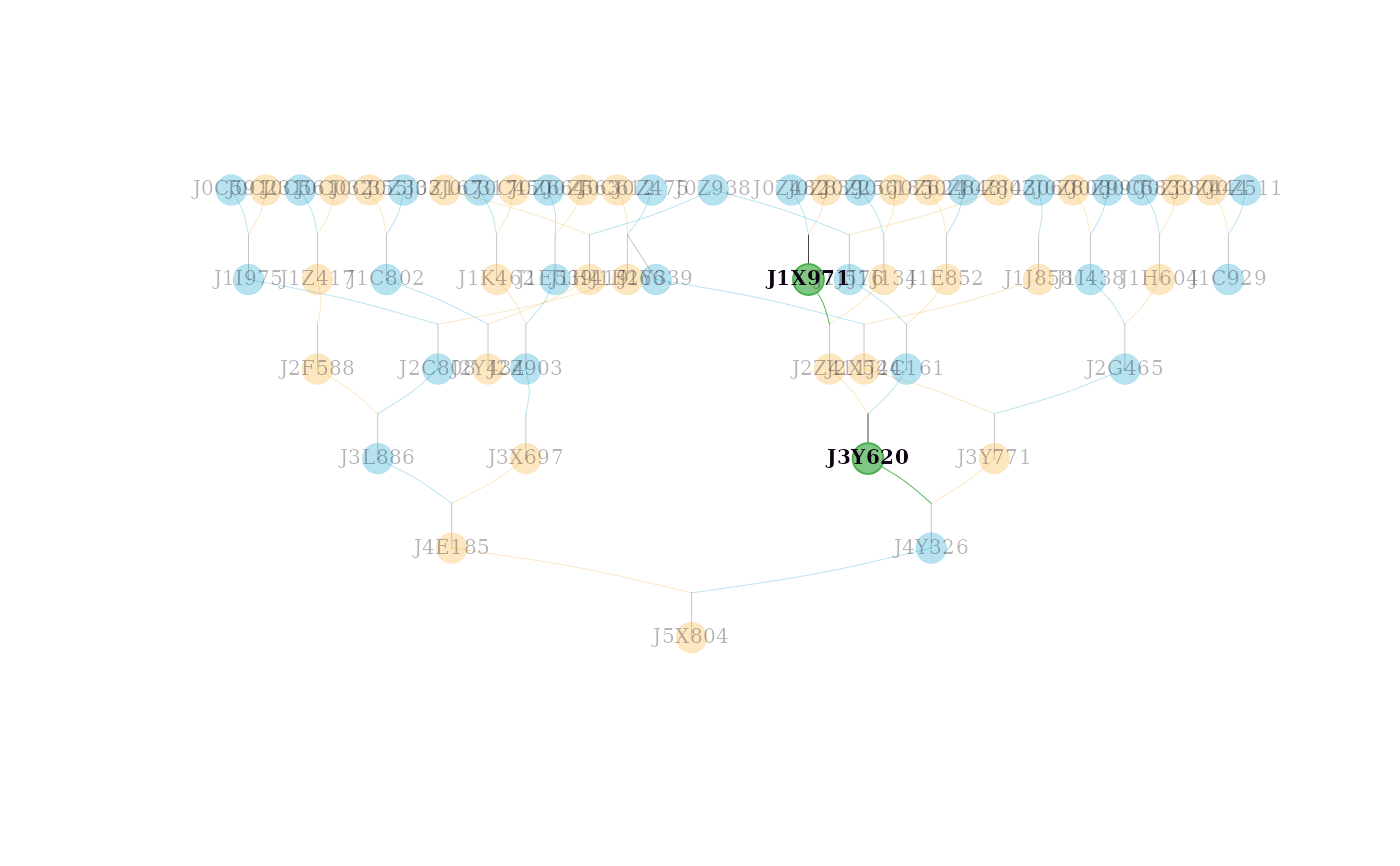
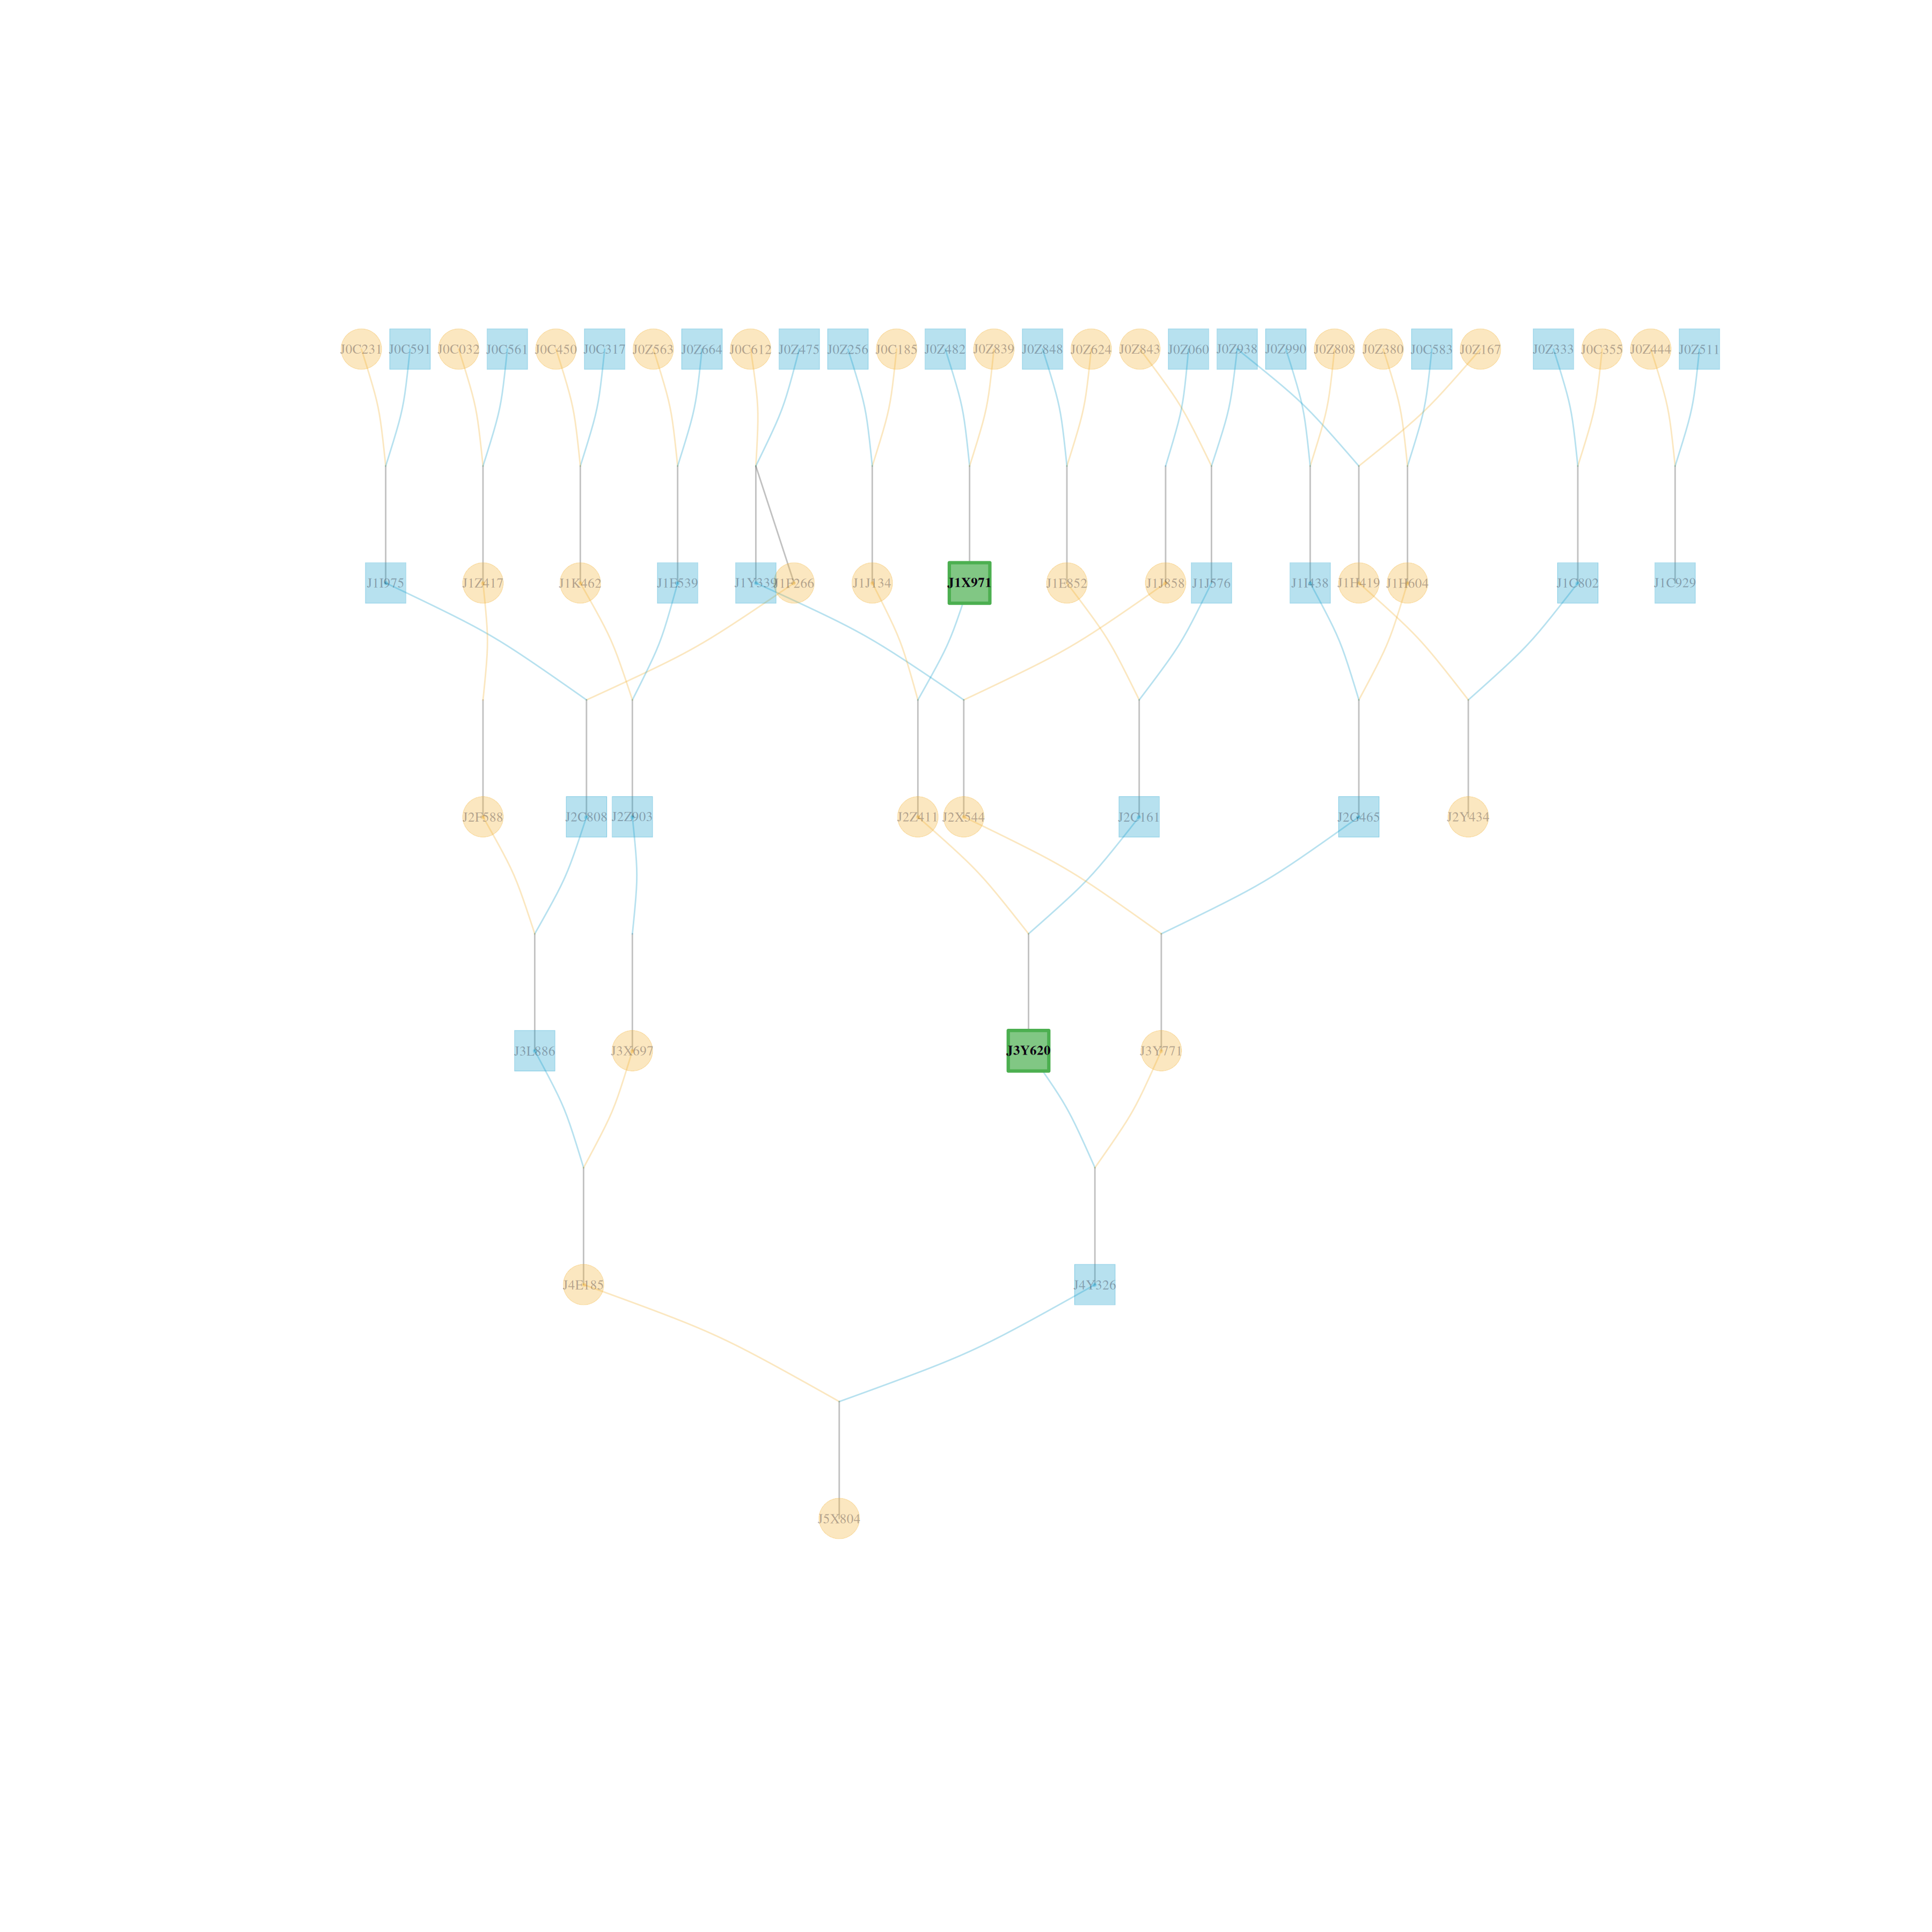
 # Highlighting multiple individuals with custom colors
visped(simple_ped_tidy,
highlight = list(ids = c("J3Y620", "J1X971"),
frame.color = "#4caf50",
color = "#81c784"),
cex=0.25,
symbolsize=5.5)
# Highlighting multiple individuals with custom colors
visped(simple_ped_tidy,
highlight = list(ids = c("J3Y620", "J1X971"),
frame.color = "#4caf50",
color = "#81c784"),
cex=0.25,
symbolsize=5.5)
 #> Label cex: 0.25. Symbol size: 5.5. Adjust 'cex' and 'symbolsize' if labels are too large or small.
#> Tip: Use 'file' to save as a legible vector PDF or SVG.
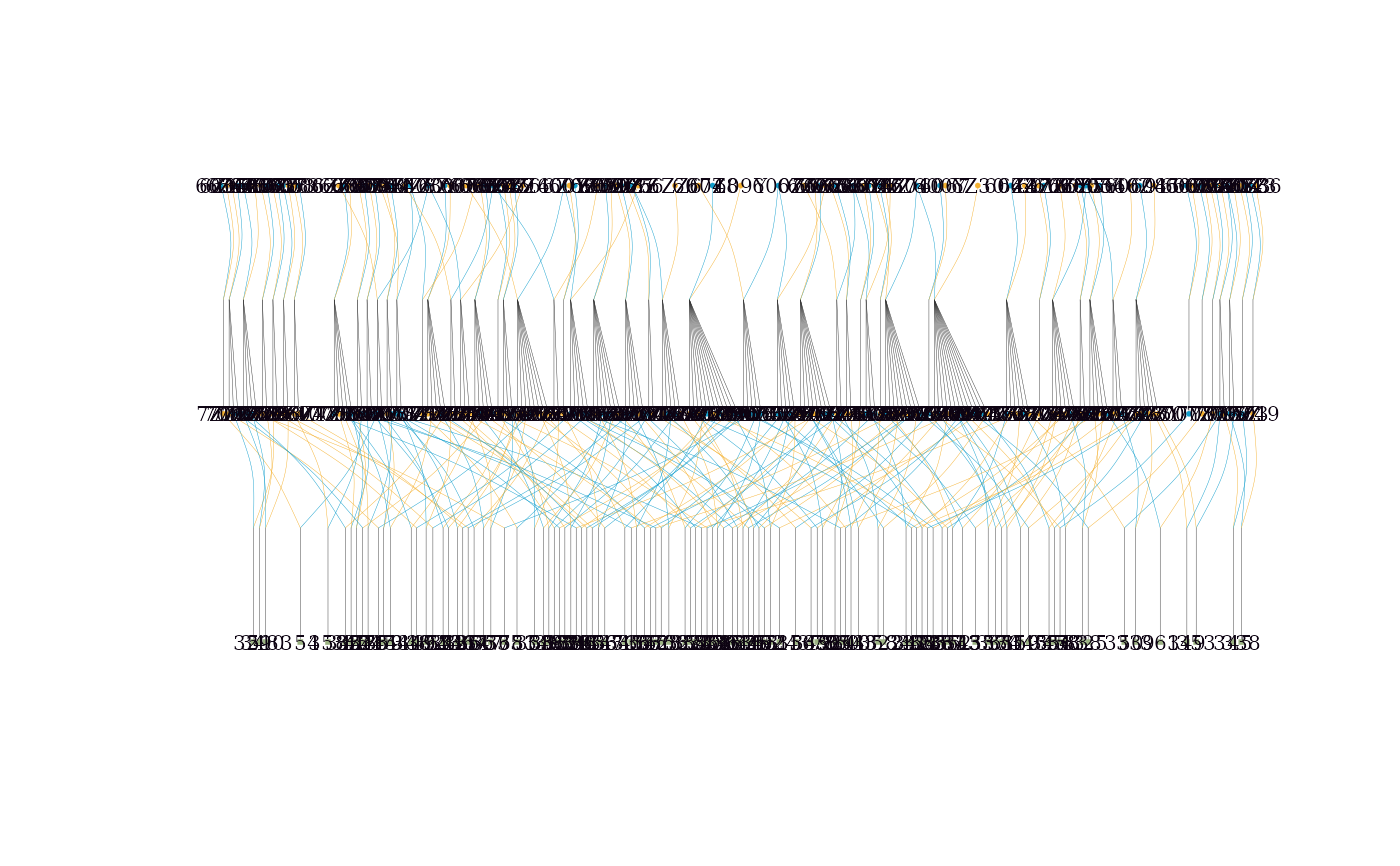
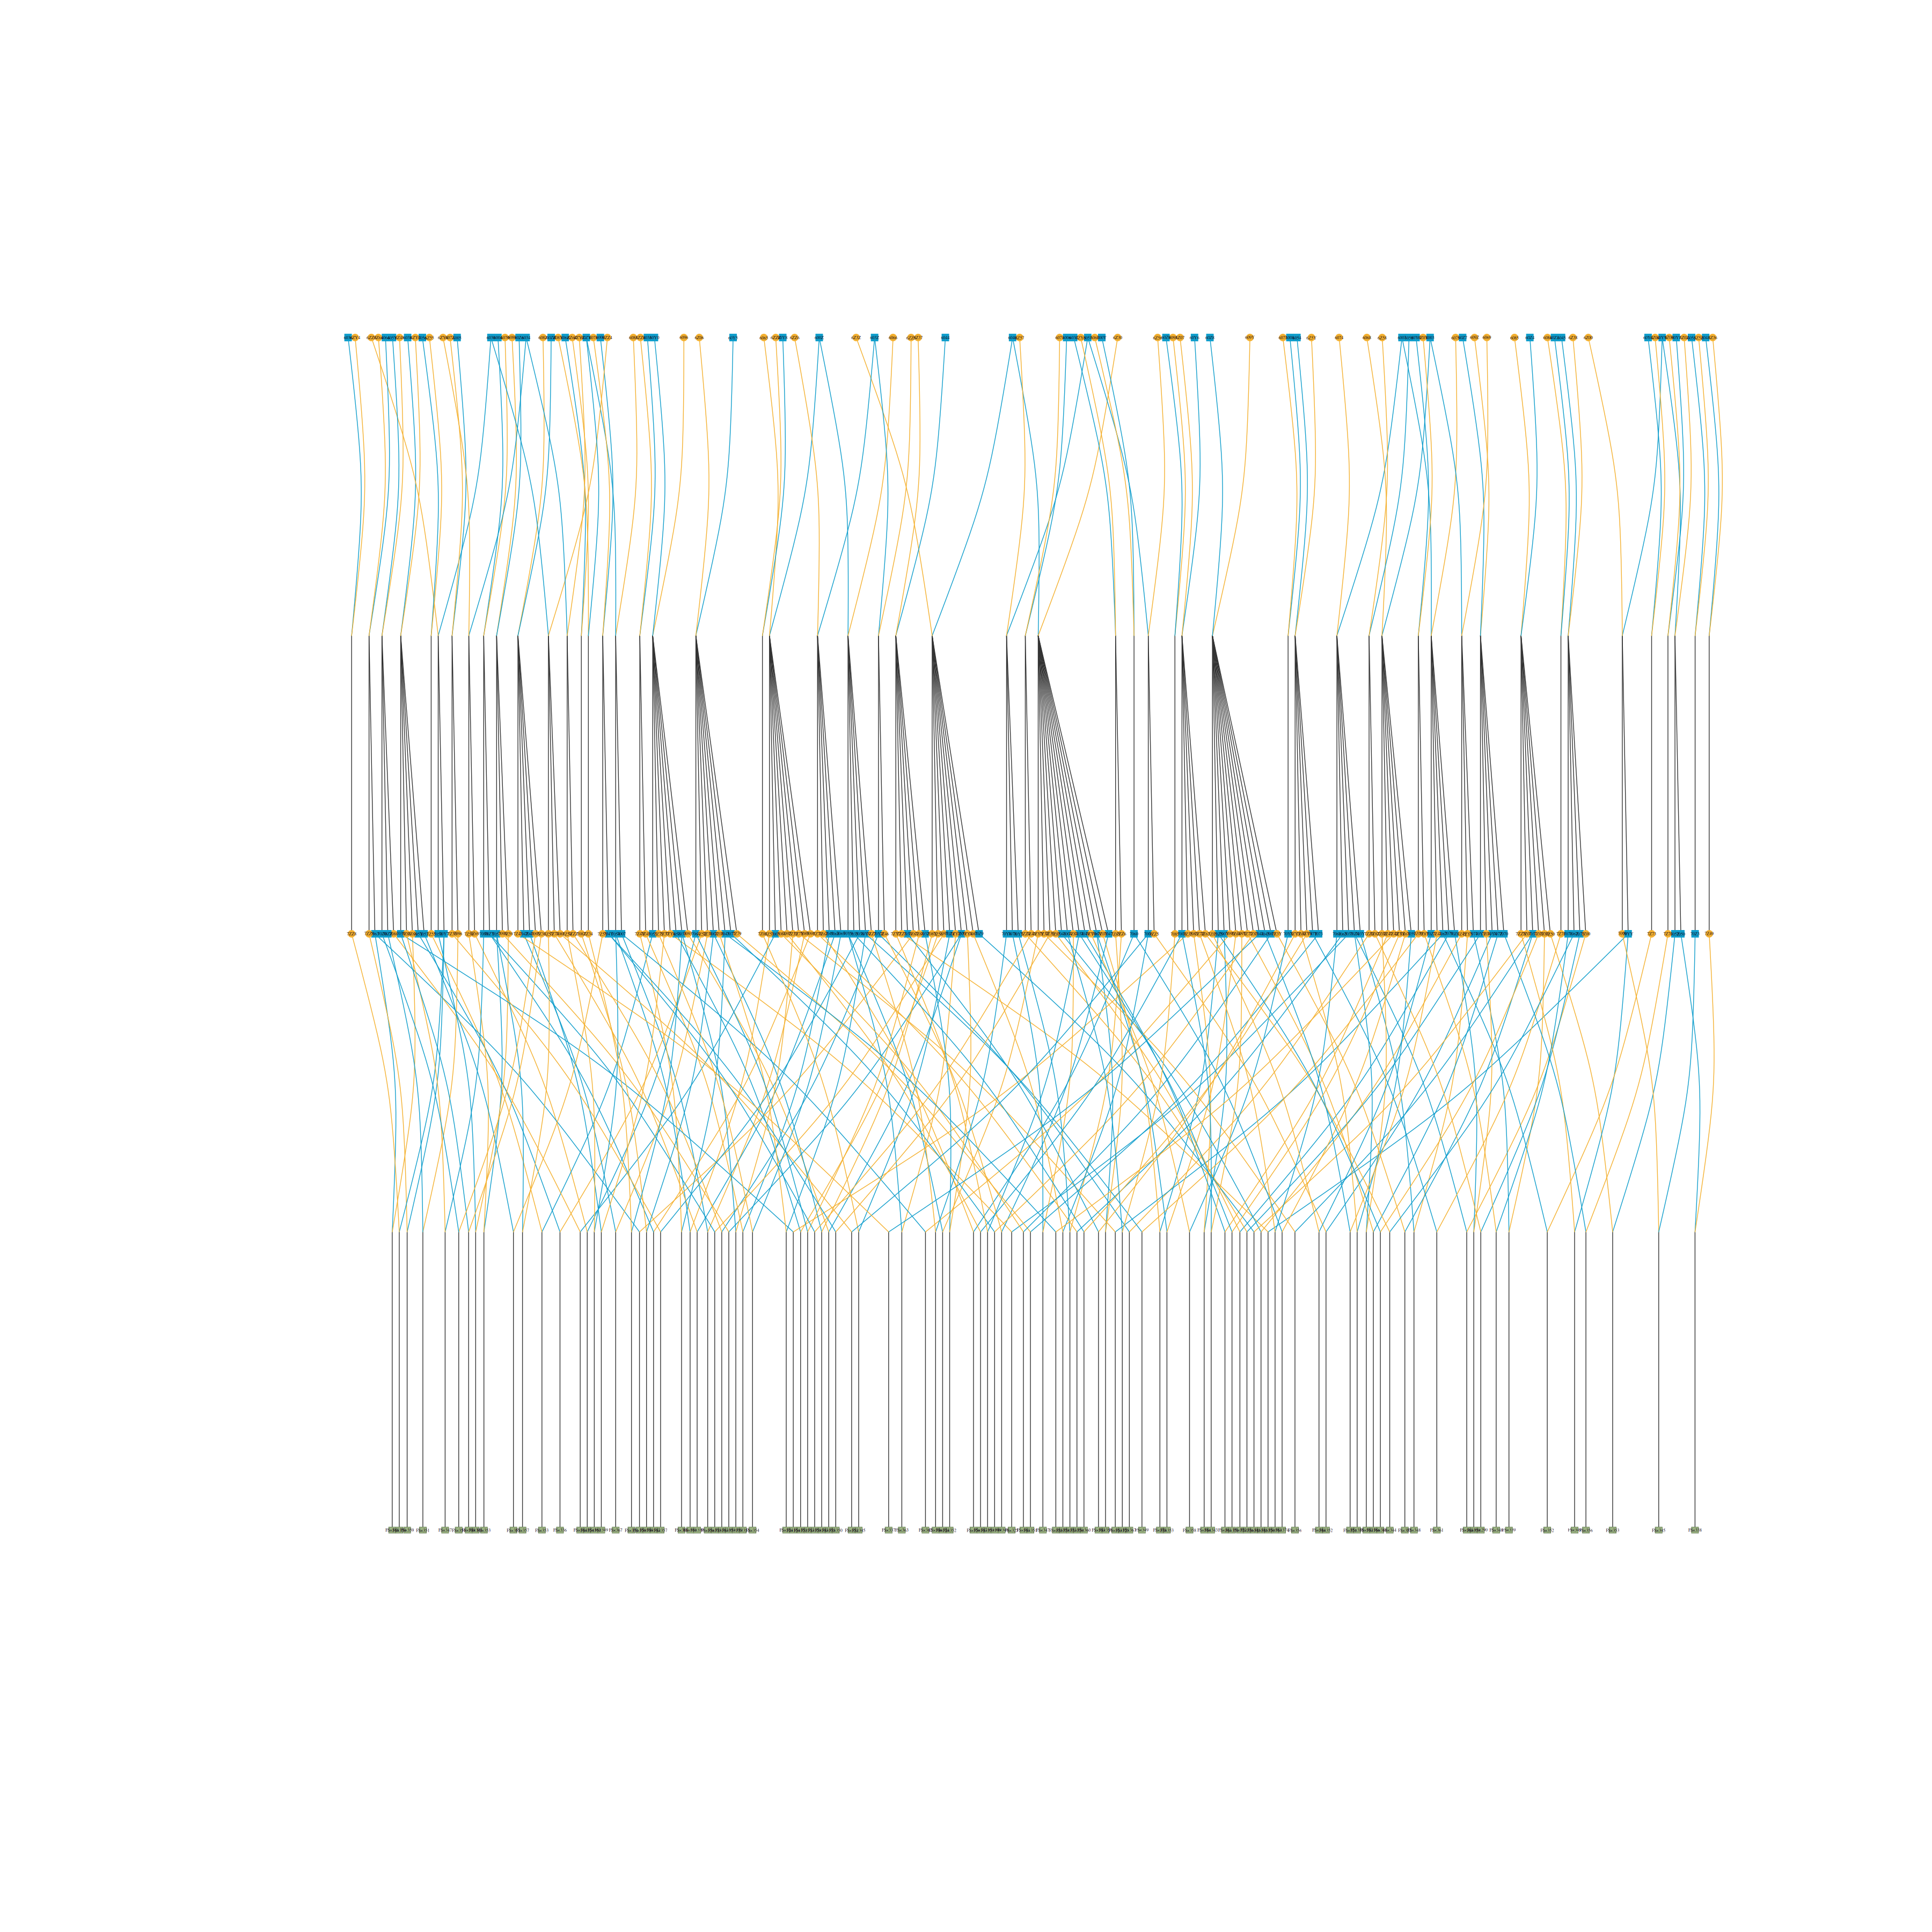
# Handling large pedigrees: Saving to PDF is recommended for legibility
# The 'trace' and 'tracegen' parameters in tidyped() help prune the graph
cand_labels <- big_family_size_ped[(Year == 2007) & (substr(Ind,1,2) == "G8"), Ind]
# \donttest{
big_ped_tidy <- tidyped(big_family_size_ped,
cand = cand_labels,
trace = "up",
tracegen = 2)
# Use compact = TRUE for large families
visped(big_ped_tidy,
compact = TRUE,
cex=0.08,
symbolsize=5.5,
file = tempfile(fileext = ".pdf"))
#> Note: Removed 351 isolated individuals (no parents, no progeny) from the plot.
#> Pedigree saved to: /tmp/RtmprOiyK6/file1c1f5d6ee4e.pdf
#> Label cex: 0.08. Symbol size: 5.5. Adjust 'cex' and 'symbolsize' if labels are too large or small.
#> Label cex: 0.25. Symbol size: 5.5. Adjust 'cex' and 'symbolsize' if labels are too large or small.
#> Tip: Use 'file' to save as a legible vector PDF or SVG.
# Handling large pedigrees: Saving to PDF is recommended for legibility
# The 'trace' and 'tracegen' parameters in tidyped() help prune the graph
cand_labels <- big_family_size_ped[(Year == 2007) & (substr(Ind,1,2) == "G8"), Ind]
# \donttest{
big_ped_tidy <- tidyped(big_family_size_ped,
cand = cand_labels,
trace = "up",
tracegen = 2)
# Use compact = TRUE for large families
visped(big_ped_tidy,
compact = TRUE,
cex=0.08,
symbolsize=5.5,
file = tempfile(fileext = ".pdf"))
#> Note: Removed 351 isolated individuals (no parents, no progeny) from the plot.
#> Pedigree saved to: /tmp/RtmprOiyK6/file1c1f5d6ee4e.pdf
#> Label cex: 0.08. Symbol size: 5.5. Adjust 'cex' and 'symbolsize' if labels are too large or small.
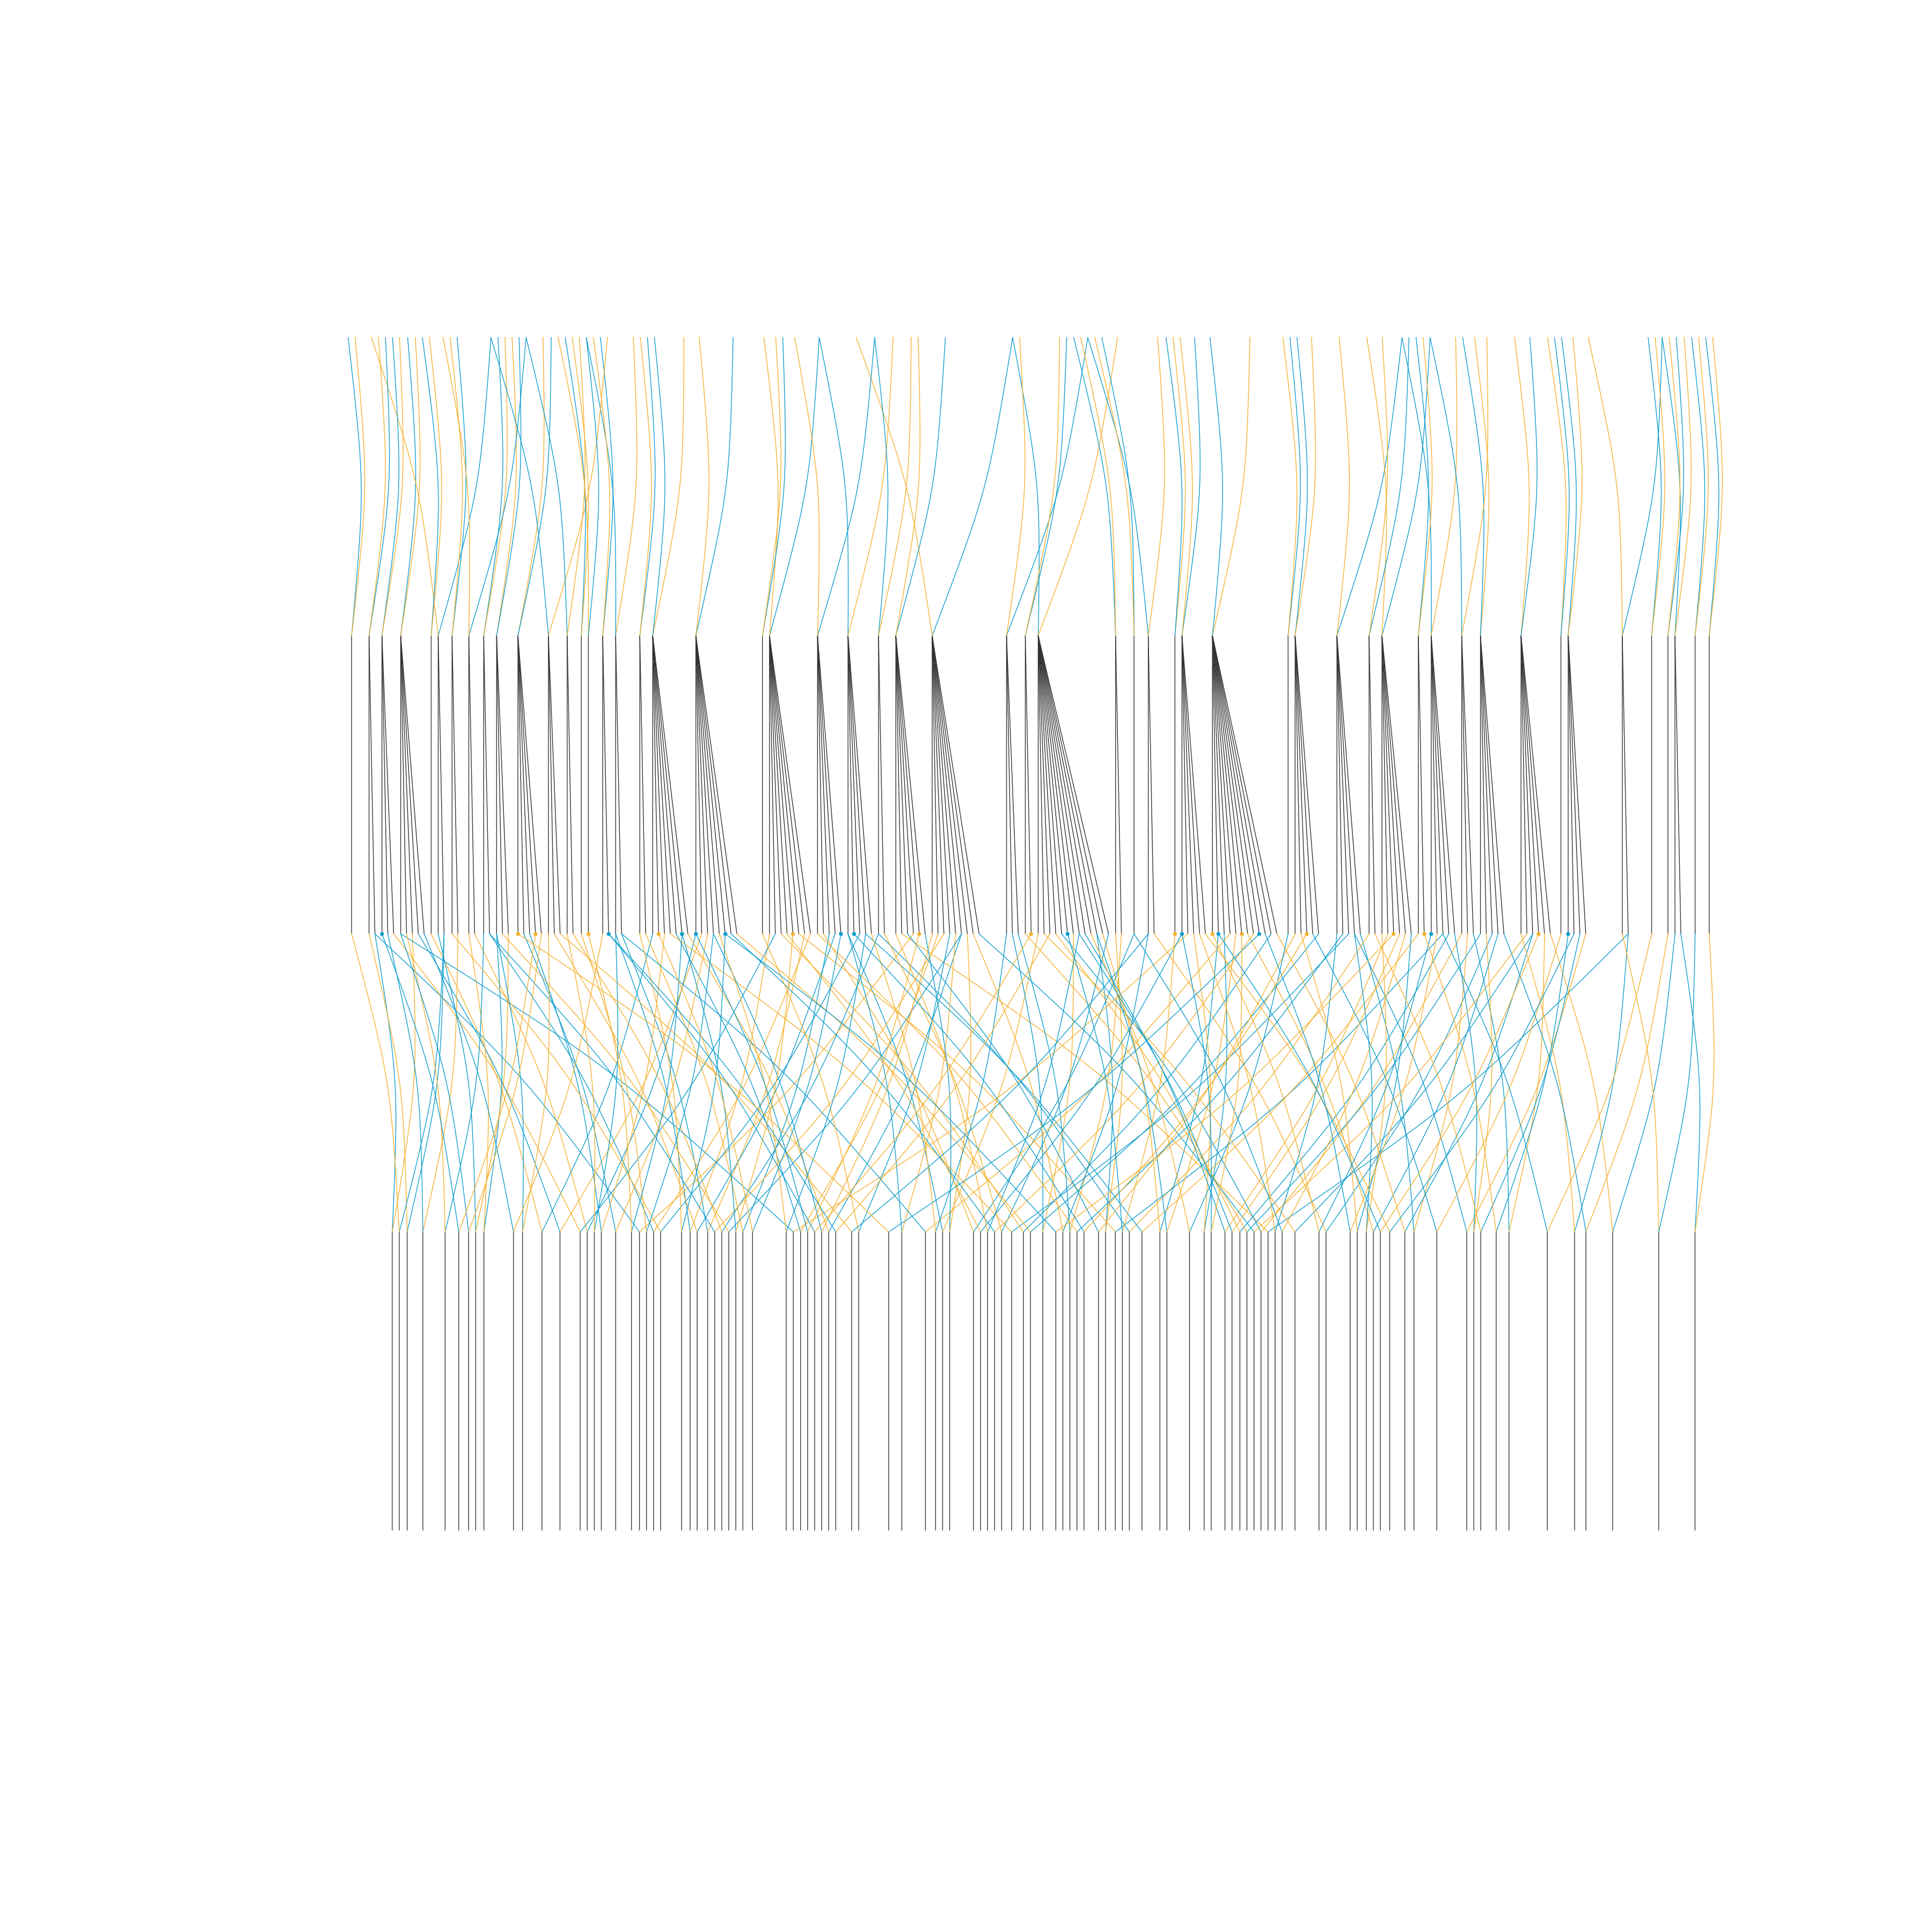
 # Use outline = TRUE if individual labels are not required
visped(big_ped_tidy,
compact = TRUE,
outline = TRUE,
file = tempfile(fileext = ".pdf"))
#> Note: Removed 351 isolated individuals (no parents, no progeny) from the plot.
#> Pedigree saved to: /tmp/RtmprOiyK6/file1c1f354ab1fc.pdf
# Use outline = TRUE if individual labels are not required
visped(big_ped_tidy,
compact = TRUE,
outline = TRUE,
file = tempfile(fileext = ".pdf"))
#> Note: Removed 351 isolated individuals (no parents, no progeny) from the plot.
#> Pedigree saved to: /tmp/RtmprOiyK6/file1c1f354ab1fc.pdf
 # }
# }